1. add_axes 表示在画板上添加一个轴域(个人理解就是在画板上开始画图)。add_axes([x0, y0, width, height])是轴域在画板上的原点坐标值及宽度,高度。
 12345fig = plt.figure() #创建一个画板# 在画板上添加一个轴域。0,0表示轴域的坐标点,1,1表示轴域的宽和高,这个是与画板的比例值。# 这里表面该轴域与画板一样大。ax = fig.add_axes([0,0,1,1])
2. add_subplot()指在画板上添加一个图,不给定坐标值,程序本身会调整大小。相比于add_axes更为灵活,特别是在画多个图时。
|
|

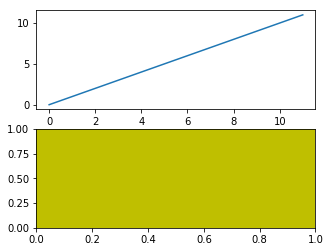
3. subplot() 画图方法,跟add_subplot类似,但使用subplot会删除之前画板上已有的图。
|
|
效果如图:
如果使用add_subplot则会保留前面创建的子图及轴域。
|
|
效果如图:

4. subplots 画图方法。
画一个图:1fig, ax = plt.subplots() # plt.subplots() 返回一个tuple,其中包含一个图片和轴域对象。
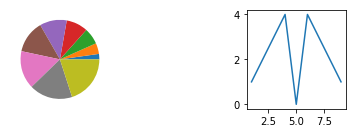
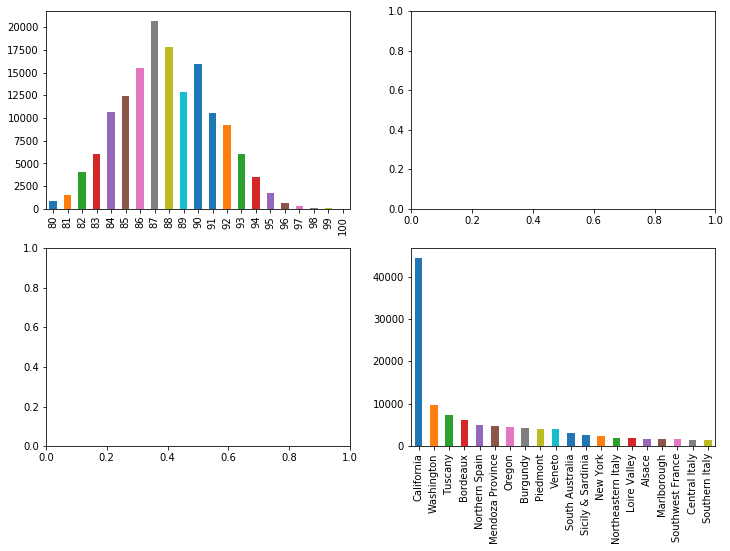
画几个图:1234567891011121314151617# 画一个一行两列的两个图。fig, axes = plt.subplots(1,2)axes[0].plot(x)axes[1].plot(x,y)#生成2行2列4个子图fig, axes = plt.subplots(2,2)#获取第一行第二列的图片reviews['points'].value_counts().sort_index().plot.bar(ax=axarr[0][0])#获取第二行第二列的图片reviews['province'].value_counts().head(20).plot.bar(ax=axarr[1][1])#设置其他标签axarr[0][0].set_title("Wine Scores", fontsize=18)
效果如图: