沧海拾珠

Matplotlib 设置坐标轴常用标签

1. pyplot.plot()创建一幅图画之后通常需要对该图的坐标名称,字体大小等进行一些简单的设置。

1
2
3
4
5
6
7
8
9
10
11
import matplotlib.pyplot as plt
from matplotlib import rcParams
#设置线的粗细及颜色
plt.plot([1,2,3,4], linewidth = 5, c = 'red')
#设置图画大小
rcParams['figure.figsize'] = 5,3
#设置图像标题
plt.title('My picture')
1
2
3
4
5
6
7
#给坐标加上标签
plt.ylabel('Y axis', fontsize = 14)
plt.xlabel('X axis', fontsize = 14)
#设置刻度标记的大小
plt.tick_params(axis = 'both', labelsize = 14)
plt.show()

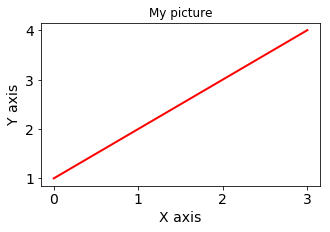
效果如图:
xylabel

2. subplot(), add_subplot() 创建的轴域其坐标标签设置方法与上面所述方法有所不同

1
2
3
4
5
6
7
8
9
10
11
12
13
14
15
rcParams['figure.figsize'] = 6, 3
# 将画布分割成2行2列,图像在从左到右从上到下的第1块
axe1 = plt.subplot(2, 2, 1)
axe1.plot([0, 1], [0, 2])
axe1.set_title('One')
axe1.set_xlabel('X axis')
axe1.set_ylabel('Y axis')
# 将画布分割成2行2列,图像在从左到右从上到下的第2块
axe2 = plt.subplot(2, 2, 2)
axe2.plot([0, 1], [0, 4])
axe2.set_title('Two')
axe2.set_xlabel('X axis')
axe2.set_ylabel('Y axis')

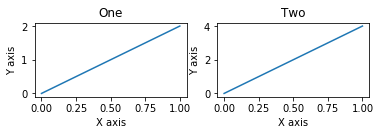
效果如图:
axes_xylabel

设置坐标轴长度及刻度。

1
2
3
4
5
6
7
8
9
10
11
fig = plt.figure()
ax = fig.add_axes([.1, .1, 1, 1])
#设置坐标轴长度
ax.set_xlim([1,10])
ax.set_ylim([0,5])
#设置刻度
ax.set_xticks([0,1,2,4,5,6,8,9,10])
ax.set_yticks([0,1,2,3,4,5])
ax.plot(x,y)

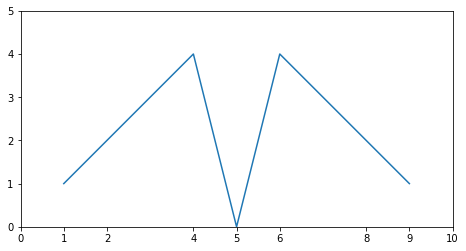
效果如图:
axes_xyticks

DataFrame作图时定义其横坐标刻度。

1
2
3
4
5
6
7
8
9
10
11
12
13
14
15
16
17
18
19
20
21
cars = pd.read_csv('mtcars.csv')
cars.columns = ['car_names','mpg','cyl','disp', 'hp', 'drat', 'wt', 'qsec', 'vs', 'am', 'gear', 'carb']
mpg = cars.mpg
#创建一块画板并在画板上作图
fig = plt.figure()
ax = fig.add_axes([.1,.1,1,1])
mpg.plot()
#定义横坐标刻度范围
ax.set_xticks(range(32))
#定义横坐标刻度标签及样式
ax.set_xticklabels(cars.car_names, rotation=60, fontsize='medium')
ax.set_title('Miles per Gallon of Cars in mtcars')
ax.set_xlabel('car names')
ax.set_ylabel('miles/gal')
#定义图注的位置
ax.legend(loc= 2)

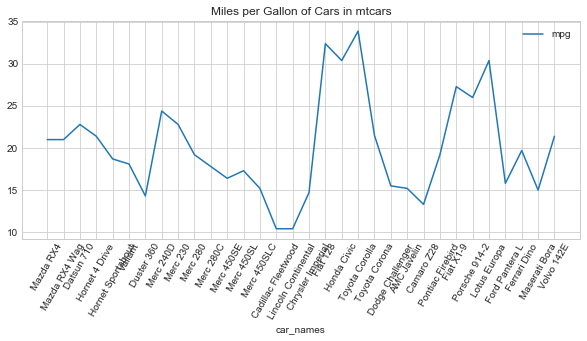
效果如图:
20180429_xaxis_label

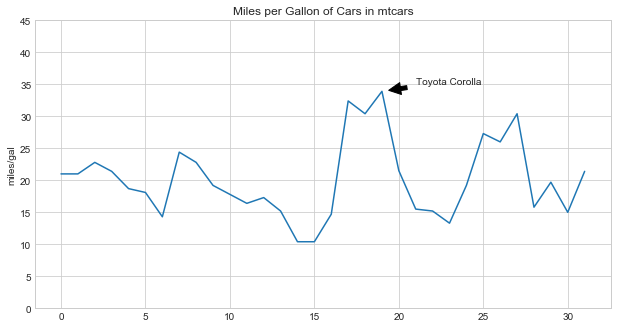
有时候需要对图中某些值进行标注,则可以使用annotate()方法。

1
2
3
4
# xy 表示需要标注的值的x,y坐标,xytext是标注本身的x,y 坐标。
# arrowprops 是一个包含指示箭头性质的字典,这里定义了箭头颜色及距离标注的距离(比例)。
ax.annotate('Toyota Corolla', xy=(19,33.9), xytext = (21,35),
arrowprops=dict(facecolor='black', shrink=0.2))

效果如图:
20180429_annotate