沧海拾珠

使用numpy进行图片处理

1. 先导入以下库 numpy, skimage以及matplotlib。

1
2
3
import numpy as np
from skimage import io #io子模块,用于读取,保存和显示图片。
import matplotlib.pyplot as plt

2. 使用一张来源于UCSanDiego WIFIRE的卫星图来作为我们的分析对象。

1
2
3
4
5
photo_data = io.imread(‘uploads/wifire_satellite.jpg’)
plt.figure(figsize=(15,15))
plt.imshow(photo_data) #显示图片

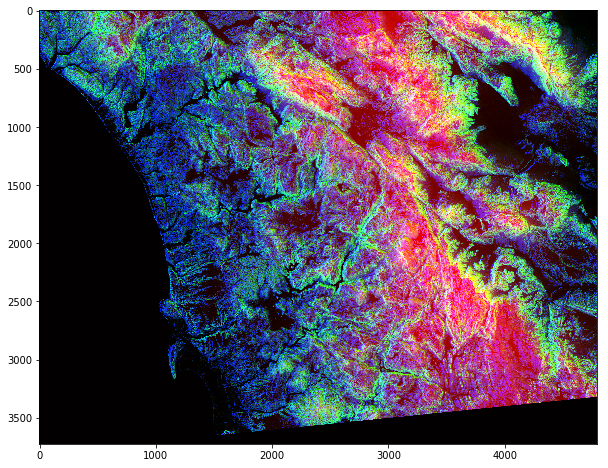
以下是该卫星图:
卫星图

3. 查看图片的基本信息。

1
2
3
4
5
type(photo_data) # 返回的数据类型为 numpy.ndarray
photo_data.shape # (3725, 4797, 3) 表示3725行,4797列,3层(红绿蓝RGB)
photo_data.size # 53606475

4. 对图片的特定行进行处理。

1
2
3
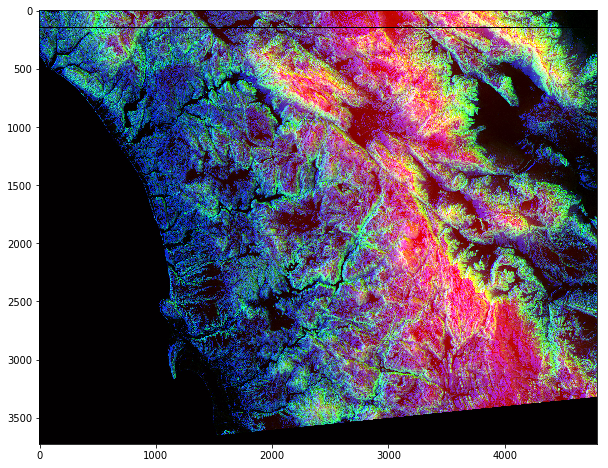
photo_data[150] = 0 # 设定150行上的所有列,所有图层的值为0。
plt.figure(figsize=(10,10))
plt.imshow(photo_data)

效果如下。
卫星图

5. 对图片的特定区域进行处理

1
2
3
4
5
6
7
photo_data = io.imread(‘uploads/wifire_satellite.jpg’)
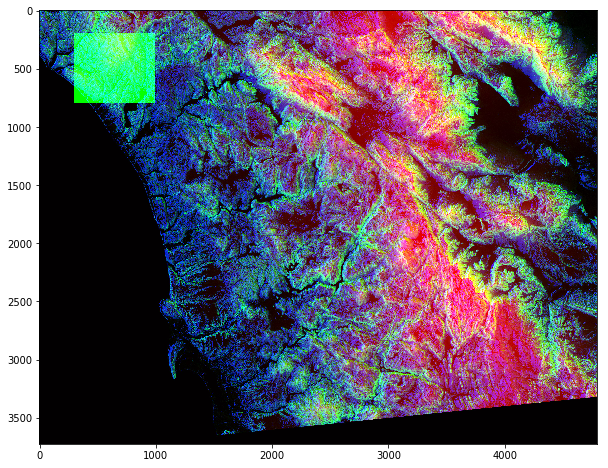
photo_data[200:800,300:1000 ,1] = 255 # 第一个图层也就是Green图层。
plt.figure(figsize=(10,10))
plt.imshow(photo_data)

效果如下。
卫星图

6. 过滤掉特定的值

1
2
3
4
5
6
low_value_filter = photo_data < 200 # 获得boolean矩阵,低于200的为True, 高于200的为False。
photo_data[low_value_filter] = 0 # boolean矩阵中为True的,对应photo_data中的值设为0。
plt.figure(figsize=(10,10))
plt.imshow(photo_data)

效果如下。
卫星图

7. 对某一图层进行处理

1
2
3
4
5
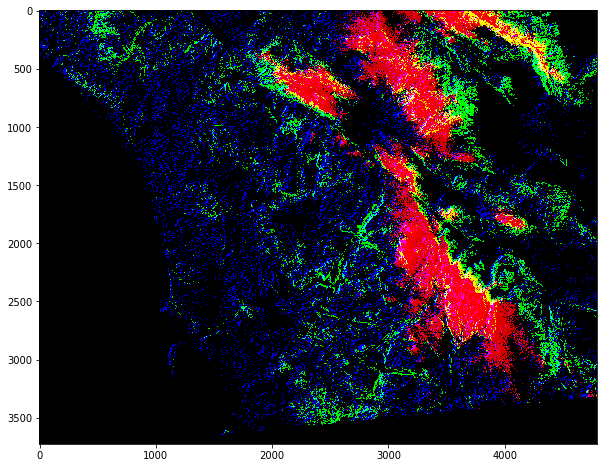
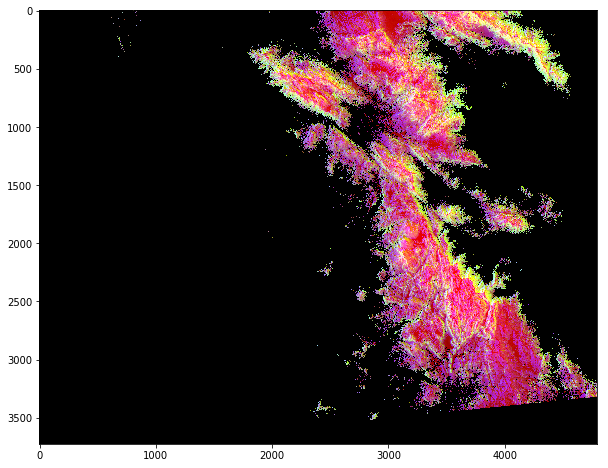
red_mask = photo_data[:, : ,0] < 150 # 0 表示红色图层,这里红色像素表示高度。这里只显示高海拔地区。
photo_data[red_mask] = 0
plt.figure(figsize=(15,15))
plt.imshow(photo_data)

效果如下。
卫星图

8. 同时对所有图层的值进行处理

1
2
3
4
5
6
7
8
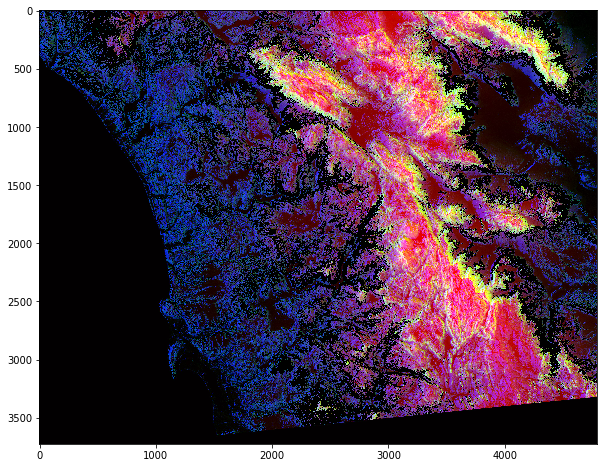
red_mask = photo_data[:, : ,0] < 150
green_mask = photo_data[:, : ,1] > 100
blue_mask = photo_data[:, : ,2] < 100
final_mask = np.logical_and(red_mask, green_mask, blue_mask)
photo_data[final_mask] = 0
plt.figure(figsize=(10,10))
plt.imshow(photo_data)

效果如下。
卫星图